AUSTRALIAN GAMBLING STATISTICS REPORT RELEASED
Each year, with the assistance of the state governments, the Queensland Government Statistician’s Office compiles a report tracking gambling trends across Australia. The first report was published in 1992 and the data covers interesting changes in gambling patterns in Australia. While we are constantly reading about increased losses by gamblers on gaming machines written and published by anti-poker machine lobby groups the “official” data shows a decline that has been ongoing for many years.
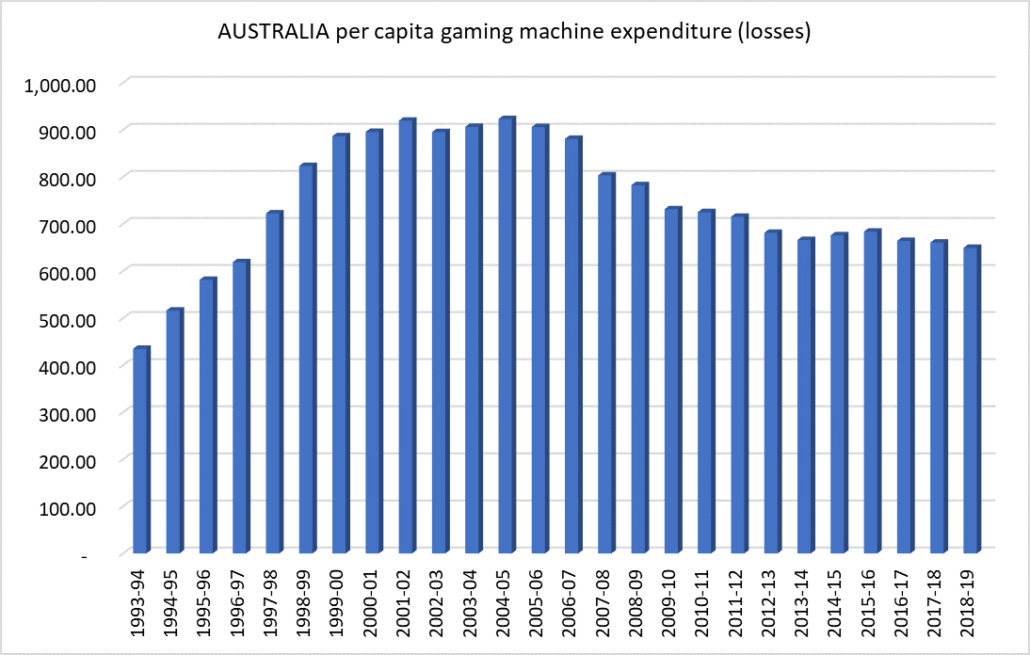
Australia – per capita poker machine losses
Per capita gaming machine expenditure (losses by poker machine gamblers) has been in decline since 2005. The current report shows an average per capita loss for 2018-2019 in poker machines of $649.23, a decline of just over 17% in the last 10 years (from $782.47 in 2008-2009)
Australia – state per capita poker machine losses
Only NT has seen any significant increases in per capita gaming machine expenditure since 2013. While NSW and QLD did see small increases between 2013 and 2016, since then they have both been in continued decline.

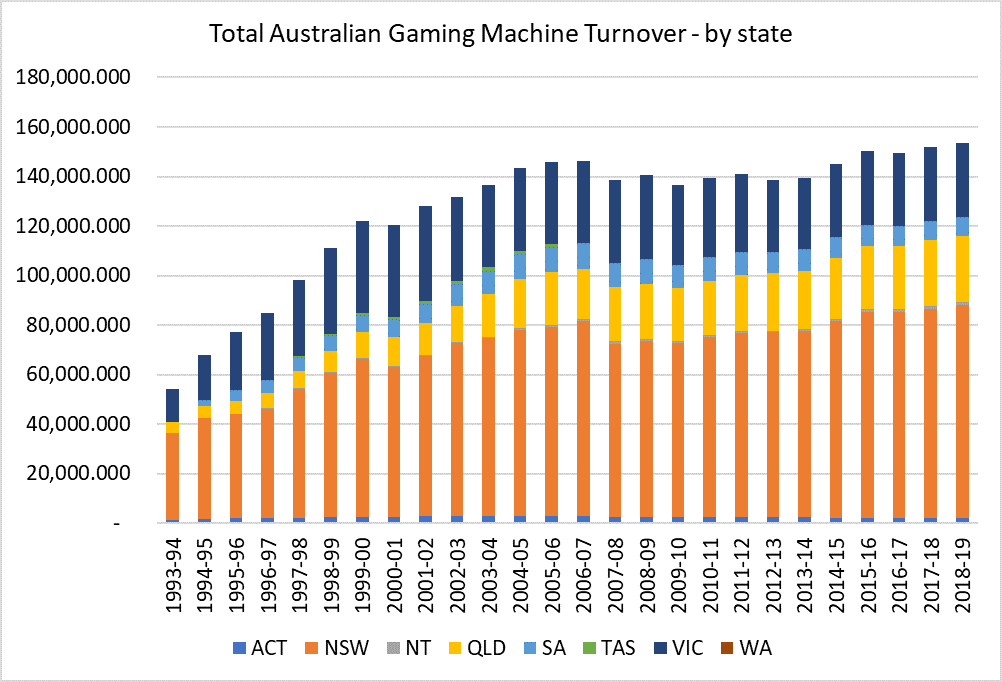
Total Australian gaming machine turnover
The total turnover on gaming machines across Australia has increased. However, as we have seen above, due to a significant lift in the return to player percentages and link jackpots on gaming machines (and a small yearly population increase) the per capita spend has declined.
The full report can be downloaded here >>> https://www.qgso.qld.gov.au/statistics/theme/society/gambling/australian-gambling-statistics#current-release-australian-gambling-statistics